Sample report · Illustrative data
Sample WMS audit report:
what an engagement returns
Before you send anything, see what comes back. This is a complete sample report for a fictional distribution center, built with invented but internally consistent data, so you can judge the method, the depth and the format for yourself.
Short answer
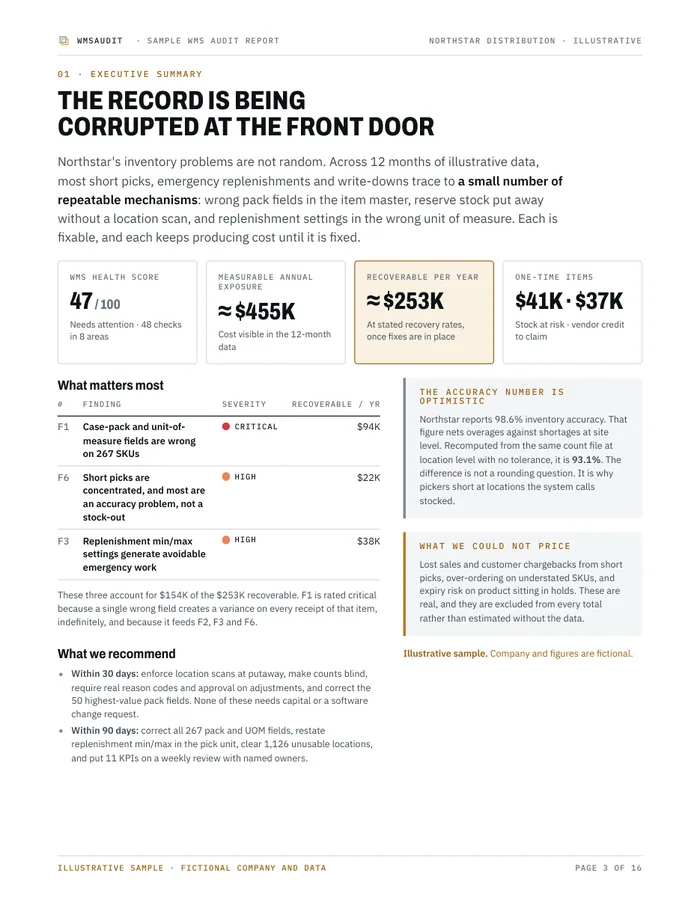
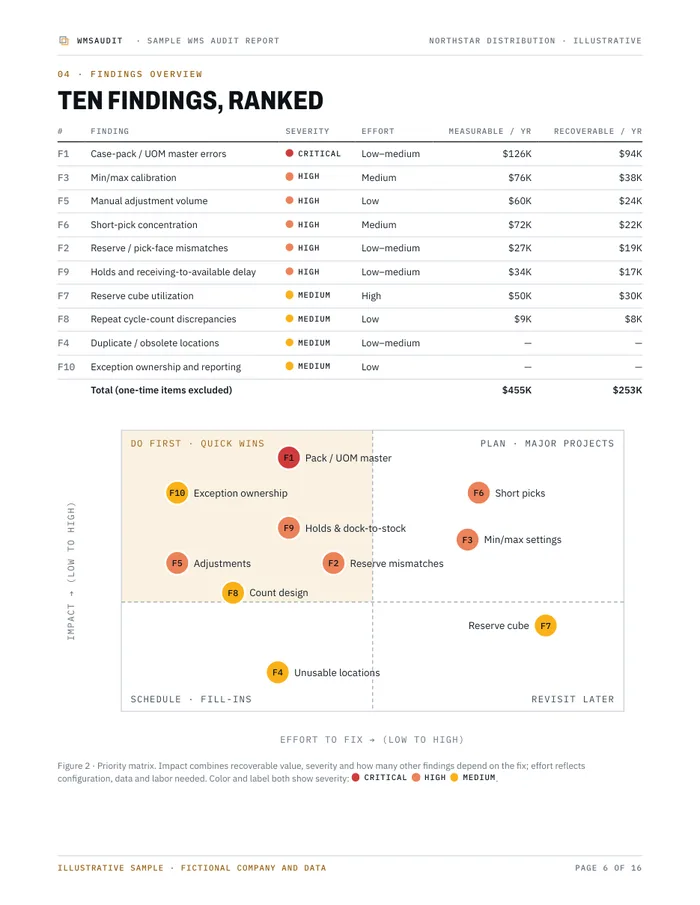
The sample report covers Northstar Distribution, a fictional 250,000 sq ft consumer goods distributor with 18,000 SKUs. It shows a WMS health score from 48 checks, ten findings each with evidence, root cause, recommendation and the formula behind every dollar figure, a priority matrix, quick wins, a 30/60/90-day plan and a KPI baseline. The company and all data are invented.
Download the sample
Illustrative sample. Northstar Distribution is a fictional company. Every name, SKU, figure and finding in the report is invented to show method and format. WMSAudit has not audited this company, and nothing in it is a typical, expected or guaranteed result.
What's inside
- Executive summary: the three findings that matter most, measurable versus recoverable money, and what could not be priced.
- Health score: 48 checks in eight areas, scored from the data, with the scoring method shown.
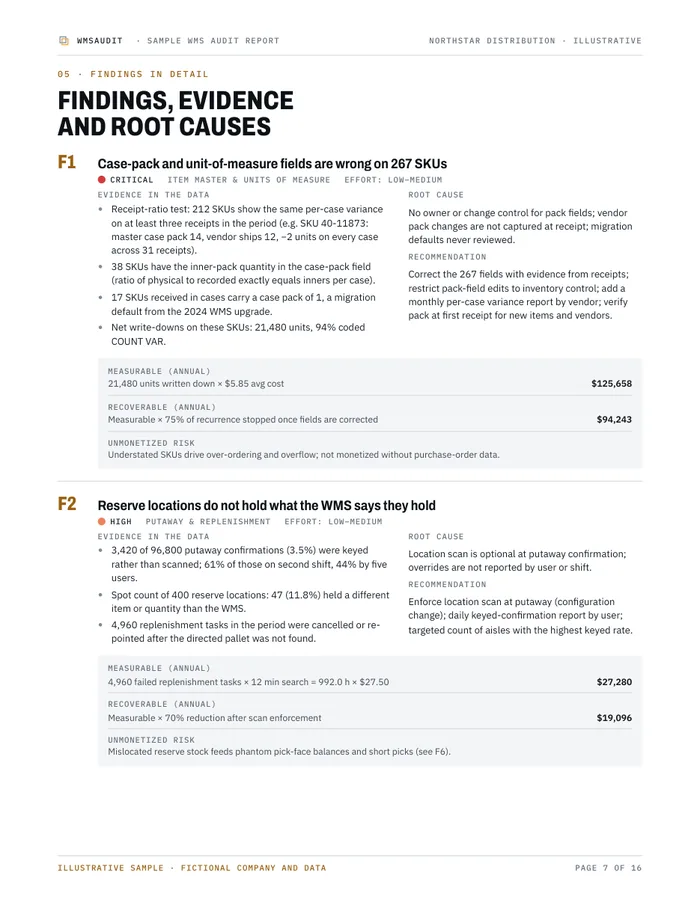
- Ten findings: case-pack and UOM master errors, keyed putaway, min/max in the wrong unit, unusable locations, adjustment volume, short-pick concentration, reserve cube, count design, holds and dock-to-stock time, and exception ownership.
- Every dollar figure with its formula: measurable exposure, recoverable opportunity and unmonetized risk kept apart, and one-time items never added to annual totals.
- Action plan: quick wins with owners, a 30/60/90-day roadmap, KPI baseline and targets, and a control cadence.
Sample vs a real report
- The same
- Structure, tests, the standard a finding has to meet, how money is separated, and the level of operational detail.
- Different
- A real report uses your data and your costs, lists the actual SKUs, vendors, locations and users behind each finding, and ships with evidence files and the queries used so your team can re-run every check. It also comes with a 60-minute readout.
Talk about your operation
Tell us a little about the building and the number you can't explain. You'll get a reply within one business day to set up a 20-minute call.
Related WMSAudit guides
- The WMS audit What a warehouse data audit examines, the exports it needs, and what it honestly cannot conclude.
- Free case-pack check Send one export; get the SKUs whose pack field is probably wrong, with evidence. Free.
- WMS audit checklist 48 checks across eight areas, each with the export to pull. Scores in the browser.
- Warehouse inventory audit Count audit or data audit: which one fixes the problem you actually have.
- The WMSAudit engagement Scope, method, fixed fee and what the report contains.